

[Jan-2024] Databricks-Certified-Professional-Data-Engineer Pre-Exam Practice Tests | Exam Questions and Answers for Databricks Certification Study Guide
Databricks Certified Professional Data Engineer Exam Certification Sample Questions
Databricks Certified Professional Data Engineer (Databricks-Certified-Professional-Data-Engineer) Certification Exam is a highly valued industry certification that validates the skills and expertise of data engineers in using Databricks to build and manage data pipelines. Databricks is a cloud-based data platform that offers a unified analytics engine for big data and machine learning. Databricks Certified Professional Data Engineer Exam certification exam is designed to test the candidate's knowledge of Databricks architecture, data engineering best practices, and data pipeline design and implementation.
Databricks Certified Professional Data Engineer exam is designed for professionals who want to showcase their expertise in building and managing data pipelines on the Databricks platform. Databricks is a unified analytics platform that provides powerful tools for data engineers, data scientists, and business analysts to collaborate and build data-driven solutions. Databricks-Certified-Professional-Data-Engineer exam is a great opportunity for data engineers to validate their skills and knowledge in using Databricks to build scalable data pipelines.
NEW QUESTION # 48
You are currently working on a notebook that will populate a reporting table for downstream process consumption, this process needs to run on a schedule every hour, what type of cluster are you going to use to set up this job?
- A. The job cluster is best suited for this purpose.
- B. Use Azure VM to read and write delta tables in Python
- C. Use delta live table pipeline to run in continuous mode
- D. Since it's just a single job and we need to run every hour, we can use an all-purpose cluster
Answer: A
Explanation:
Explanation
The answer is, The Job cluster is best suited for this purpose.
Since you don't need to interact with the notebook during the execution especially when it's a scheduled job, job cluster makes sense. Using an all-purpose cluster can be twice as expensive as a job cluster.
FYI,
When you run a job scheduler with option of creating a new cluster when the job is complete it terminates the cluster. You cannot restart a job cluster.
NEW QUESTION # 49
You were asked to create or overwrite an existing delta table to store the below transaction data.
- A. 1.CREATE OR REPLACE DELTA TABLE transactions (
2.transactionId int,
3.transactionDate timestamp,
4.unitsSold int) - B. 1.CREATE IF EXSITS REPLACE TABLE transactions (
2.transactionId int,
3.transactionDate timestamp,
4.unitsSold int) - C. 1.CREATE OR REPLACE TABLE IF EXISTS transactions (
2.transactionId int,
3.transactionDate timestamp,
4.unitsSold int)
5.FORMAT DELTA - D. 1.CREATE OR REPLACE TABLE transactions (
2.transactionId int,
3.transactionDate timestamp,
4.unitsSold int)
Answer: D
Explanation:
Explanation
The answer is
1.CREATE OR REPLACE TABLE transactions (
2.transactionId int,
3.transactionDate timestamp,
4.unitsSold int)
When creating a table in Databricks by default the table is stored in DELTA format.
NEW QUESTION # 50
How to determine if a table is a managed table vs external table?
- A. Run SQL command SHOW TABLES to see the type of the table
- B. All managed tables are stored in unity catalog
- C. Run SQL command DESCRIBE EXTENDED table_name and check type
- D. All external tables are stored in data lake, managed tables are stored in DELTA lake
- E. Run IS_MANAGED('table_name') function
Answer: C
Explanation:
Explanation
The answer is Run SQL command DESCRIBE EXTENDED table_name and check type Example of External table Graphical user interface, text, application Description automatically generated
Example of managed table
Graphical user interface, text, application, Teams Description automatically generated
NEW QUESTION # 51
A data engineer is using a Databricks SQL query to monitor the performance of an ELT job. The ELT job is triggered by a specific number of input records being ready to process. The Databricks SQL query returns the number of minutes since the job's most recent runtime. Which of the following approaches can enable the data engineering team to be notified if the ELT job has not been run in an hour?
- A. They can set up an Alert for the query to notify them if the returned value is greater than 60.
- B. This type of alert is not possible in Databricks
- C. They can set up an Alert for the accompanying dashboard to notify them if the returned value is greater than 60.
- D. They can set up an Alert for the query to notify when the ELT job fails.
- E. They can set up an Alert for the accompanying dashboard to notify when it has not re-freshed in 60 minutes.
Answer: A
Explanation:
Explanation
The answer is, They can set up an Alert for the query to notify them if the returned value is greater than 60.
The important thing to note here is that alert can only be setup on query not on the dashboard, query can return a value, which is used if alert can be triggered.
NEW QUESTION # 52
if you run the command VACUUM transactions retain 0 hours? What is the outcome of this command?
- A. Command will be successful, but no data is removed
- B. Command will be successful, but historical data will be removed
- C. Command will fail if you have an active transaction running
- D. Command will fail, you cannot run the command with retentionDurationcheck enabled
- E. Command runs successful and compacts all of the data in the table
Answer: D
Explanation:
Explanation
The answer is,
Command will fail, you cannot run the command with retentionDurationcheck enabled.
1.VACUUM [ [db_name.]table_name | path] [RETAIN num HOURS] [DRY RUN]
*Recursively vacuum directories associated with the Delta table and remove data files that are no longer in the latest state of the transaction log for the table and are older than a retention threshold. Default is 7 Days.
*The reason this check is enabled is because, DELTA is trying to prevent unintentional deletion of history, and also one important thing to point out is with 0 hours of retention there is a possibility of data loss(see below kb) Documentation in VACUUM https://docs.delta.io/latest/delta-utility.html
https://kb.databricks.com/delta/data-missing-vacuum-parallel-write.html
NEW QUESTION # 53
A denote the event 'student is female' and let B denote the event 'student is French'. In a class of 100 students
suppose 60 are French, and suppose that 10 of the French students are females. Find the probability that if I
pick a French student, it will be a girl, that is, find P(A|B).
- A. 2/3
- B. 1/6
- C. 1/3
- D. 2/6
Answer: B
Explanation:
Explanation
Since 10 out of 100 students are both French and female, then
P(AandB)=10100
Also. 60 out of the 100 students are French, so
P(B)=60100
So the required probability is:
P(A|B)=P(AandB)P(B)=10/10060/100=16
NEW QUESTION # 54
A data engineer has ingested a JSON file into a table raw_table with the following schema:
1.transaction_id STRING,
2.payload ARRAY<customer_id:STRING, date:TIMESTAMP, store_id:STRING>
The data engineer wants to efficiently extract the date of each transaction into a table with the fol-lowing
schema:
1.transaction_id STRING,
2.date TIMESTAMP
Which of the following commands should the data engineer run to complete this task?
- A. 1.SELECT transaction_id, payload[date]
2.FROM raw_table; - B. 1.SELECT transaction_id, explode(payload)
2.FROM raw_table; - C. 1.SELECT transaction_id, date from payload
2.FROM raw_table; - D. 1.SELECT transaction_id, date
2.FROM raw_table; - E. 1.SELECT transaction_id, payload.date
2.FROM raw_table;
Answer: E
NEW QUESTION # 55
Which one of the following is not a Databricks lakehouse object?
- A. Tables
- B. Views
- C. Stored Procedures
- D. Functions
- E. Database/Schemas
- F. Catalog
Answer: C
Explanation:
Explanation
The answer is, Stored Procedures.
Databricks lakehouse does not support stored procedures.
NEW QUESTION # 56
A production workload incrementally applies updates from an external Change Data Capture feed to a Delta Lake table as an always-on Structured Stream job. When data was initially migrated for this table, OPTIMIZE was executed and most data files were resized to 1 GB. Auto Optimize and Auto Compaction were both turned on for the streaming production job. Recent review of data files shows that most data files are under 64 MB, although each partition in the table contains at least 1 GB of data and the total table size is over 10 TB.
Which of the following likely explains these smaller file sizes?
- A. Databricks has autotuned to a smaller target file size based on the overall size of data in the table
- B. Databricks has autotuned to a smaller target file size based on the amount of data in each partition
- C. Z-order indices calculated on the table are preventing file compaction C Bloom filler indices calculated on the table are preventing file compaction
- D. Databricks has autotuned to a smaller target file size to reduce duration of MERGE operations
Answer: D
Explanation:
Explanation
This is the correct answer because Databricks has a feature called Auto Optimize, which automatically optimizes the layout of Delta Lake tables by coalescing small files into larger ones and sorting data within each file by a specified column. However, Auto Optimize also considers the trade-off between file size and merge performance, and may choose a smaller target file size to reduce the duration of merge operations, especially for streaming workloads that frequently update existing records. Therefore, it is possible that Auto Optimize has autotuned to a smaller target file size based on the characteristics of the streaming production job. Verified References: [Databricks Certified Data Engineer Professional], under "Delta Lake" section; Databricks Documentation, under "Auto Optimize" section.https://docs.databricks.com/en/delta/tune-file-size.html#autotune-table 'Autotune file size based on workload'
NEW QUESTION # 57
Which of the following SQL statements can be used to update a transactions table, to set a flag on the table from Y to N
- A. MERGE transactions SET active_flag = 'N' WHERE active_flag = 'Y'
- B. REPLACE transactions SET active_flag = 'N' WHERE active_flag = 'Y'
- C. UPDATE transactions SET active_flag = 'N' WHERE active_flag = 'Y'
- D. MODIFY transactions SET active_flag = 'N' WHERE active_flag = 'Y'
Answer: B
Explanation:
Explanation
The answer is
UPDATE transactions SET active_flag = 'N' WHERE active_flag = 'Y'
Delta Lake supports UPDATE statements on the delta table, all of the changes as part of the update are ACID compliant.
NEW QUESTION # 58
A new data engineer notices that a critical field was omitted from an application that writes its Kafka source to Delta Lake. This happened even though the critical field was in the Kafka source. That field was further missing from data written to dependent, long-term storage. The retention threshold on the Kafka service is seven days. The pipeline has been in production for three months.
Which describes how Delta Lake can help to avoid data loss of this nature in the future?
- A. Data can never be permanently dropped or deleted from Delta Lake, so data loss is not possible under any circumstance.
- B. Delta Lake schema evolution can retroactively calculate the correct value for newly added fields, as long as the data was in the original source.
- C. Ingestine all raw data and metadata from Kafka to a bronze Delta table creates a permanent, replayable history of the data state.
- D. Delta Lake automatically checks that all fields present in the source data are included in the ingestion layer.
- E. The Delta log and Structured Streaming checkpoints record the full history of the Kafka producer.
Answer: C
Explanation:
Explanation
This is the correct answer because it describes how Delta Lake can help to avoid data loss of this nature in the future. By ingesting all raw data and metadata from Kafka to a bronze Delta table, Delta Lake creates a permanent, replayable history of the data state that can be used for recovery or reprocessing in case of errors or omissions in downstream applications or pipelines. Delta Lake also supports schema evolution, which allows adding new columns to existing tables without affecting existing queries or pipelines. Therefore, if a critical field was omitted from an application that writes its Kafka source to Delta Lake, it can be easily added later and the data can be reprocessed from the bronze table without losing any information. Verified References:
[Databricks Certified Data Engineer Professional], under "Delta Lake" section; Databricks Documentation, under "Delta Lake core features" section.
NEW QUESTION # 59
A Spark job is taking longer than expected. Using the Spark UI, a data engineer notes that the Min, Median, and Max Durations for tasks in a particular stage show the minimum and median time to complete a task as roughly the same, but the max duration for a task to be roughly 100 times as long as the minimum.
Which situation is causing increased duration of the overall job?
- A. Spill resulting from attached volume storage being too small.
- B. Credential validation errors while pulling data from an external system.
- C. Network latency due to some cluster nodes being in different regions from the source data
- D. Skew caused by more data being assigned to a subset of spark-partitions.
- E. Task queueing resulting from improper thread pool assignment.
Answer: D
Explanation:
Explanation
This is the correct answer because skew is a common situation that causes increased duration of the overall job. Skew occurs when some partitions have more data than others, resulting in uneven distribution of work among tasks and executors. Skew can be caused by various factors, such as skewed data distribution, improper partitioning strategy, or join operations with skewed keys. Skew can lead to performance issues such as long-running tasks, wasted resources, or even task failures due to memory or disk spills. Verified References:
[Databricks Certified Data Engineer Professional], under "Performance Tuning" section; Databricks Documentation, under "Skew" section.
NEW QUESTION # 60
A user new to Databricks is trying to troubleshoot long execution times for some pipeline logic they are working on. Presently, the user is executing code cell-by-cell, usingdisplay()calls to confirm code is producing the logically correct results as new transformations are added to an operation. To get a measure of average time to execute, the user is running each cell multiple times interactively.
Which of the following adjustments will get a more accurate measure of how code is likely to perform in production?
- A. Production code development should only be done using an IDE; executing code against a local build of open source Spark and Delta Lake will provide the most accurate benchmarks for how code will perform in production.
- B. The Jobs Ul should be leveraged to occasionally run the notebook as a job and track execution time during incremental code development because Photon can only be enabled on clusters launched for scheduled jobs.
- C. The only way to meaningfully troubleshoot code execution times in development notebooks Is to use production-sized data and production-sized clusters with Run All execution.
- D. Calling display () forces a job to trigger, while many transformations will only add to the logical query plan; because of caching, repeated execution of the same logic does not provide meaningful results.
- E. Scala is the only language that can be accurately tested using interactive notebooks; because the best performance is achieved by using Scala code compiled to JARs. all PySpark and Spark SQL logic should be refactored.
Answer: D
Explanation:
Explanation
This is the correct answer because it explains which of the following adjustments will get a more accurate measure of how code is likely to perform in production. The adjustment is that calling display() forces a job to trigger, while many transformations will only add to the logical query plan; because of caching, repeated execution of the same logic does not provide meaningful results. When developing code in Databricks notebooks, one should be aware of how Spark handles transformations and actions. Transformations are operations that create a new DataFrame or Dataset from an existing one, such as filter, select, or join. Actions are operations that trigger a computation on a DataFrame or Dataset and return a result to the driver program or write it to storage, such as count, show, or save. Calling display() on a DataFrame or Dataset is also an action that triggers a computation and displays the result in a notebook cell. Spark uses lazy evaluation for transformations, which means that they are not executed until an action is called. Spark also uses caching to store intermediate results in memory or disk for faster access in subsequent actions. Therefore, calling display() forces a job to trigger, while many transformations will only add to the logical query plan; because of caching, repeated execution of the same logic does not provide meaningful results. To get a more accurate measure of how code is likely to perform in production, one should avoid calling display() too often or clear the cache before running each cell. Verified References: [Databricks Certified Data Engineer Professional], under "Spark Core" section; Databricks Documentation, under "Lazy evaluation" section; Databricks Documentation, under "Caching" section.
NEW QUESTION # 61
A data engineer needs to create a database called customer360 at the loca-tion /customer/customer360. The
data engineer is unsure if one of their colleagues has already created the database.
Which of the following commands should the data engineer run to complete this task?
- A. CREATE DATABASE customer360 DELTA LOCATION '/customer/customer360';
- B. CREATE DATABASE customer360 LOCATION '/customer/customer360';
- C. CREATE DATABASE IF NOT EXISTS customer360;
- D. CREATE DATABASE IF NOT EXISTS customer360 DELTA LOCATION '/customer/customer360';
- E. CREATE DATABASE IF NOT EXISTS customer360 LOCATION '/customer/customer360';
Answer: E
NEW QUESTION # 62
How does a Delta Lake differ from a traditional data lake?
- A. Delta lake is Datawarehouse service on top of data lake that can provide reliability, se-curity, and performance
- B. Delta lake is an open storage format like parquet with additional capabilities that can provide reliability, security, and performance
- C. Delta lake is a caching layer on top of data lake that can provide reliability, security, and performance
- D. Delta lake is an open storage format designed to replace flat files with additional capa-bilities that can provide reliability, security, and performance
- E. Delta lake is proprietary software designed by Databricks that can provide reliability, security, and performance
Answer: B
Explanation:
Explanation
Answer is, Delta lake is an open storage format like parquet with additional capabilities that can provide reliability, security, and performance Delta lake is
* Open source
* Builds up on standard data format
* Optimized for cloud object storage
* Built for scalable metadata handling
Delta lake is not
* Proprietary technology
* Storage format
* Storage medium
* Database service or data warehouse
NEW QUESTION # 63
A Databricks SQL dashboard has been configured to monitor the total number of records present in a collection of Delta Lake tables using the following query pattern:
SELECT COUNT (*) FROM table -
Which of the following describes how results are generated each time the dashboard is updated?
- A. The total count of records is calculated from the parquet file metadata
- B. The total count of records is calculated from the Hive metastore
- C. The total count of rows will be returned from cached results unless REFRESH is run
- D. The total count of rows is calculated by scanning all data files
- E. The total count of records is calculated from the Delta transaction logs
Answer: E
Explanation:
Explanation
https://delta.io/blog/2023-04-19-faster-aggregations-metadata/#:~:text=You%20can%20get%20the%20number,a
NEW QUESTION # 64
A Databricks job has been configured with 3 tasks, each of which is a Databricks notebook. Task A does not depend on other tasks. Tasks B and C run in parallel, with each having a serial dependency on Task A.
If task A fails during a scheduled run, which statement describes the results of this run?
- A. Because all tasks are managed as a dependency graph, no changes will be committed to the Lakehouse until all tasks have successfully been completed.
- B. Tasks B and C will attempt to run as configured; any changes made in task A will be rolled back due to task failure.
- C. Unless all tasks complete successfully, no changes will be committed to the Lakehouse; because task A failed, all commits will be rolled back automatically.
- D. Tasks B and C will be skipped; task A will not commit any changes because of stage failure.
- E. Tasks B and C will be skipped; some logic expressed in task A may have been committed before task failure.
Answer: E
Explanation:
Explanation
When a Databricks job runs multiple tasks with dependencies, the tasks are executed in a dependency graph. If a task fails, the downstream tasks that depend on it are skipped and marked as Upstream failed. However, the failed task may have already committed some changes to the Lakehouse before the failure occurred, and those changes are not rolled back automatically. Therefore, the job run may result in a partial update of the Lakehouse. To avoid this, you can use the transactional writes feature of Delta Lake to ensure that the changes are only committed when the entire job run succeeds. Alternatively, you can use the Run if condition to configure tasks to run even when some or all of their dependencies have failed, allowing your job to recover from failures and continue running. References:
transactional writes: https://docs.databricks.com/delta/delta-intro.html#transactional-writes Run if: https://docs.databricks.com/en/workflows/jobs/conditional-tasks.html
NEW QUESTION # 65
You are working on IOT data where each device has 5 reading in an array collected in Celsius, you were asked to covert each individual reading from Celsius to Fahrenheit, fill in the blank with an appropriate function that can be used in this scenario.
Schema: deviceId INT, deviceTemp ARRAY<double>
SELECT deviceId, __(deviceTempC,i-> (i * 9/5) + 32) as deviceTempF
FROM sensors
- A. APPLY
- B. MULTIPLY
- C. ARRAYEXPR
- D. FORALL
- E. TRANSFORM
Answer: E
Explanation:
Explanation
TRANSFORM -> Transforms elements in an array in expr using the function func.
1.transform(expr, func)
NEW QUESTION # 66
Which of the following describes a benefit of a data lakehouse that is unavailable in a traditional data
warehouse?
- A. A data lakehouse couples storage and compute for complete control
- B. A data lakehouse enables both batch and streaming analytics
- C. A data lakehouse provides a relational system of data management
- D. A data lakehouse captures snapshots of data for version control purposes
- E. A data lakehouse utilizes proprietary storage formats for data
Answer: B
NEW QUESTION # 67
A production cluster has 3 executor nodes and uses the same virtual machine type for the driver and executor.
When evaluating the Ganglia Metrics for this cluster, which indicator would signal a bottleneck caused by code executing on the driver?
- A. The five Minute Load Average remains consistent/flat
- B. Bytes Received never exceeds 80 million bytes per second
- C. Network I/O never spikes
- D. Total Disk Space remains constant
- E. Overall cluster CPU utilization is around 25%
Answer: E
Explanation:
Explanation
This is the correct answer because it indicates a bottleneck caused by code executing on the driver. A bottleneck is a situation where the performance or capacity of a system is limited by a single component or resource. A bottleneck can cause slow execution, high latency, or low throughput. A production cluster has 3 executor nodes and uses the same virtual machine type for the driver and executor. When evaluating the Ganglia Metrics for this cluster, one can look for indicators that show how the cluster resources are being utilized, such as CPU, memory, disk, or network. If the overall cluster CPU utilization is around 25%, it means that only one out of the four nodes (driver + 3 executors) is using its full CPU capacity, while the other three nodes are idle or underutilized. This suggests that the code executing on the driver is taking too long or consuming too much CPU resources, preventing the executors from receiving tasks or data to process. This can happen when the code has driver-side operations that are not parallelized or distributed, such as collecting large amounts of data to the driver, performing complex calculations on the driver, or using non-Spark libraries on the driver. Verified References: [Databricks Certified Data Engineer Professional], under "Spark Core" section; Databricks Documentation, under "View cluster status and event logs - Ganglia metrics" section; Databricks Documentation, under "Avoid collecting large RDDs" section.
In a Spark cluster, the driver node is responsible for managing the execution of the Spark application, including scheduling tasks, managing the execution plan, and interacting with the cluster manager. If the overall cluster CPU utilization is low (e.g., around 25%), it may indicate that the driver node is not utilizing the available resources effectively and might be a bottleneck.
NEW QUESTION # 68
You had worked with the Data analysts team to set up a SQL Endpoint(SQL warehouse) point so they can easily query and analyze data in the gold layer, but once they started consuming the SQL Endpoint(SQL warehouse) you noticed that during the peak hours as the number of users increase you are seeing queries taking longer to finish, which of the following steps can be taken to resolve the issue?
*Please note Databricks recently renamed SQL endpoint to SQL warehouse.
- A. They can increase the maximum bound of the SQL endpoint(SQL warehouse) 's scaling range.
- B. They can turn on the Auto Stop feature for the SQL endpoint(SQL warehouse) .
- C. They can turn on the Serverless feature for the SQL endpoint(SQL warehouse).
- D. They can turn on the Serverless feature for the SQL endpoint(SQL warehouse) and change the Spot Instance Policy from "Cost optimized" to "Reliability Optimized."
- E. They can increase the cluster size from 2X-Small to 4X-Large of the SQL end-point(SQL warehouse) .
Answer: A
Explanation:
Explanation
the answer is,
They can increase the maximum bound of the SQL endpoint's scaling range, when you increase the maximum bound you can add more clusters to the warehouse which can then run additional queries that are waiting in the queue to run, focus on the below explanation that talks about Scale-out.
The question is looking to test your ability to know how to scale a SQL Endpoint(SQL Warehouse) and you have to look for cue words or need to understand if the queries are running sequentially or concurrently. if the queries are running sequentially then scale up(Size of the cluster from 2X-Small to 4X-Large) if the queries are running concurrently or with more users then scale out(add more clusters).
SQL Endpoint(SQL Warehouse) Overview: (Please read all of the below points and the below diagram to understand )
1.A SQL Warehouse should have at least one cluster
2.A cluster comprises one driver node and one or many worker nodes
3.No of worker nodes in a cluster is determined by the size of the cluster (2X -Small ->1 worker, X-Small ->2 workers.... up to 4X-Large -> 128 workers) this is called Scale up
4.A single cluster irrespective of cluster size(2X-Smal.. to ...4XLarge) can only run 10 queries at any given time if a user submits 20 queries all at once to a warehouse with 3X-Large cluster size and cluster scaling (min
1, max1) while 10 queries will start running the remaining 10 queries wait in a queue for these 10 to finish.
5.Increasing the Warehouse cluster size can improve the performance of a query, example if a query runs for 1 minute in a 2X-Small warehouse size, it may run in 30 Seconds if we change the warehouse size to X-Small.
this is due to 2X-Small has 1 worker node and X-Small has 2 worker nodes so the query has more tasks and runs faster (note: this is an ideal case example, the scalability of a query performance depends on many factors, it can not always be linear)
6.A warehouse can have more than one cluster this is called Scale out. If a warehouse is con-figured with X-Small cluster size with cluster scaling(Min1, Max 2) Databricks spins up an additional cluster if it detects queries are waiting in the queue, If a warehouse is configured to run 2 clusters(Min1, Max 2), and let's say a user submits 20 queries, 10 queriers will start running and holds the remaining in the queue and databricks will automatically start the second cluster and starts redirecting the 10 queries waiting in the queue to the second cluster.
7.A single query will not span more than one cluster, once a query is submitted to a cluster it will remain in that cluster until the query execution finishes irrespective of how many clusters are available to scale.
Please review the below diagram to understand the above concepts: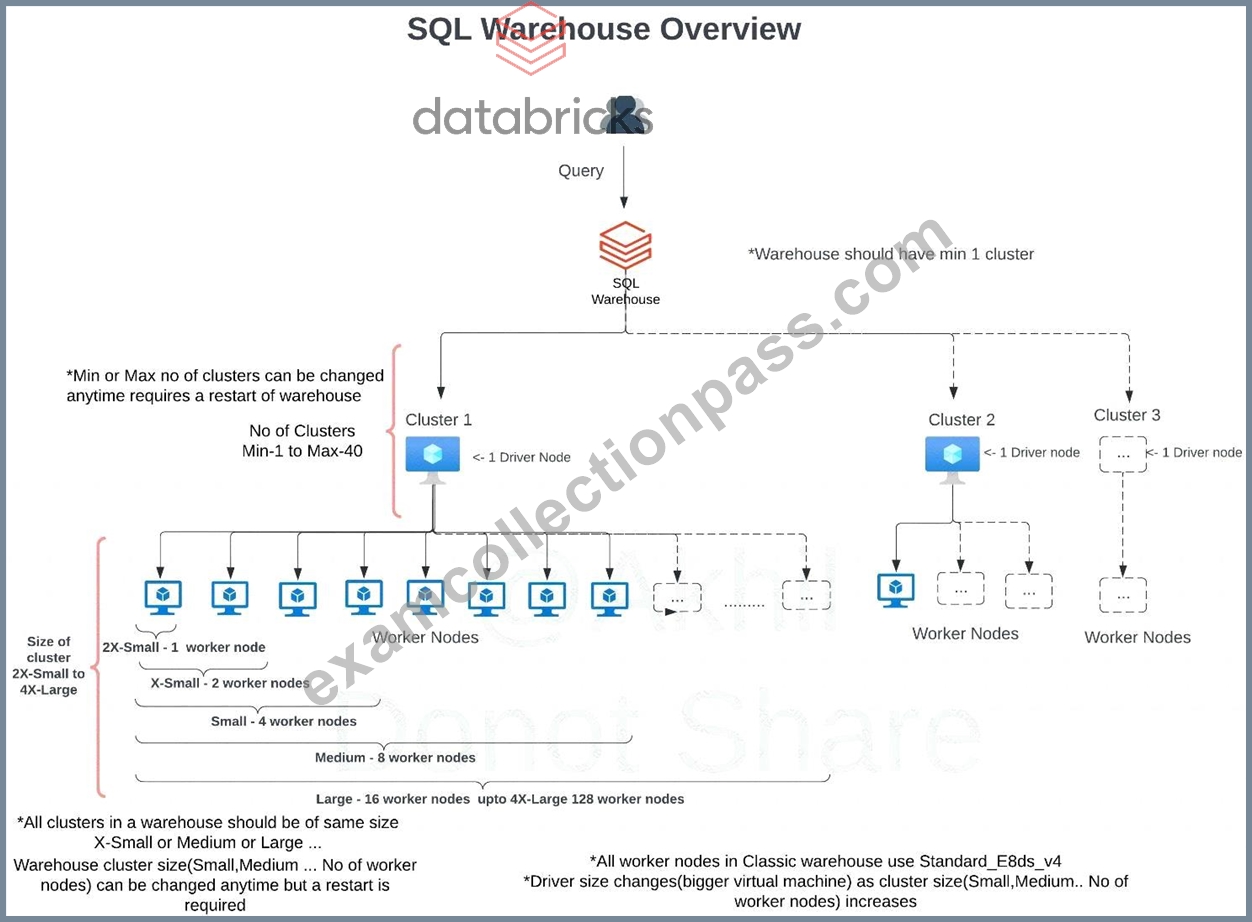
SQL endpoint(SQL Warehouse) scales horizontally(scale-out) and vertical (scale-up), you have to understand when to use what.
Scale-out -> to add more clusters for a SQL endpoint, change max number of clusters If you are trying to improve the throughput, being able to run as many queries as possible then having an additional cluster(s) will improve the performance.
Databricks SQL automatically scales as soon as it detects queries are in queuing state, in this example scaling is set for min 1 and max 3 which means the warehouse can add three clusters if it detects queries are waiting.
During the warehouse creation or after you have the ability to change the warehouse size (2X-Small....to
...4XLarge) to improve query performance and the maximize scaling range to add more clusters on a SQL Endpoint(SQL Warehouse) scale-out, if you are changing an existing warehouse you may have to restart the warehouse to make the changes effective.
How do you know how many clusters you need(How to set Max cluster size)?
When you click on an existing warehouse and select the monitoring tab, you can see warehouse utilization information(see below), there are two graphs that provide important information on how the warehouse is being utilized, if you see queries are being queued that means your warehouse can benefit from additional clusters. Please review the additional DBU cost associated with adding clusters so you can take a well balanced decision between cost and performance.
NEW QUESTION # 69
Which of the following developer operations in CI/CD flow can be implemented in Databricks Re-pos?
- A. Resolve merge conflicts
- B. Pull request and review process
- C. Merge when code is committed
- D. Trigger Databricks Repos API to pull the latest version of code into production folder
- E. Delete a branch
Answer: D
Explanation:
Explanation
See the below diagram to understand the role Databricks Repos and Git provider plays when building a CI/CD workflow.
All the steps highlighted in yellow can be done Databricks Repo, all the steps highlighted in Gray are done in a git provider like Github or Azure DevOps
NEW QUESTION # 70
Which of the following section in the UI can be used to manage permissions and grants to tables?
- A. User Settings
- B. User access control lists
- C. Workspace admin settings
- D. Data Explorer
- E. Admin UI
Answer: D
Explanation:
Explanation
The answer is Data Explorer
NEW QUESTION # 71
If you create a database sample_db with the statement CREATE DATABASE sample_db what will be the default location of the database in DBFS?
- A. Default location, /user/db/
- B. Default Storage account
- C. Default Location, dbfs:/user/hive/warehouse
- D. Default location, DBFS:/user/
- E. Statement fails "Unable to create database without location"
Answer: C
Explanation:
Explanation
The Answer is dbfs:/user/hive/warehouse this is the default location where spark stores user data-bases, the default can be changed using spark.sql.warehouse.dir a parameter. You can also provide a custom location using the LOCATION keyword.
Here is how this works,
Graphical user interface, text, application, email Description automatically generated
Default location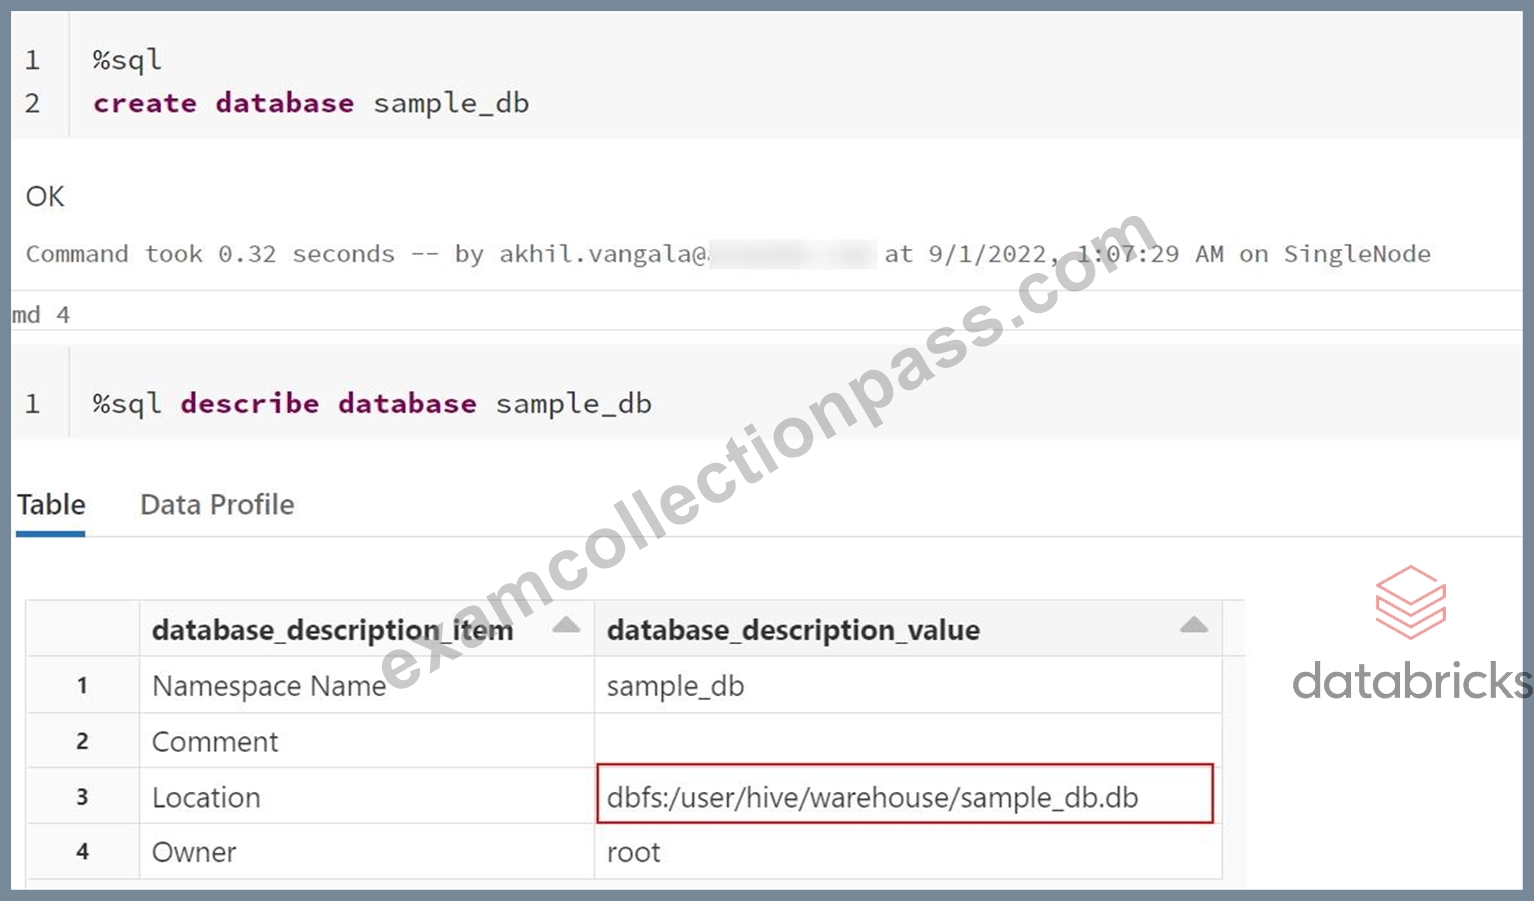
FYI, This can be changed used using cluster spark config or session config.
Modify spark.sql.warehouse.dir location to change the default location
Graphical user interface, text, application Description automatically generated

NEW QUESTION # 72
A Databricks job has been configured with 3 tasks, each of which is a Databricks notebook. Task A does not depend on other tasks. Tasks B and C run in parallel, with each having a serial dependency on task A.
If tasks A and B complete successfully but task C fails during a scheduled run, which statement describes the resulting state?
- A. Because all tasks are managed as a dependency graph, no changes will be committed to the Lakehouse until ail tasks have successfully been completed.
- B. All logic expressed in the notebook associated with tasks A and B will have been successfully completed; some operations in task C may have completed successfully.
- C. Unless all tasks complete successfully, no changes will be committed to the Lakehouse; because task C failed, all commits will be rolled back automatically.
- D. All logic expressed in the notebook associated with task A will have been successfully completed; tasks B and C will not commit any changes because of stage failure.
- E. All logic expressed in the notebook associated with tasks A and B will have been successfully completed; any changes made in task C will be rolled back due to task failure.
Answer: B
Explanation:
Explanation
The query uses the CREATE TABLE USING DELTA syntax to create a Delta Lake table from an existing Parquet file stored in DBFS. The query also uses the LOCATION keyword to specify the path to the Parquet file as /mnt/finance_eda_bucket/tx_sales.parquet. By using the LOCATION keyword, the query creates an external table, which is a table that is stored outside of the default warehouse directory and whose metadata is not managed by Databricks. An external table can be created from an existing directory in a cloud storage system, such as DBFS or S3, that contains data files in a supported format, such as Parquet or CSV.
The resulting state after running the second command is that an external table will be created in the storage container mounted to /mnt/finance_eda_bucket with the new name prod.sales_by_store. The command will not change any data or move any files in the storage container; it will only update the table reference in the metastore and create a new Delta transaction log for the renamed table. Verified References: [Databricks Certified Data Engineer Professional], under "Delta Lake" section; Databricks Documentation, under "ALTER TABLE RENAME TO" section; Databricks Documentation, under "Create an external table" section.
NEW QUESTION # 73
......
Databricks-Certified-Professional-Data-Engineer exam consists of multiple-choice questions and hands-on, real-world scenarios that test the candidate's ability to design, build, and deploy data pipelines on Databricks. Databricks-Certified-Professional-Data-Engineer exam covers various topics, including data engineering concepts, Databricks architecture, data processing using Spark, and data integration with other systems. Databricks Certified Professional Data Engineer Exam certification program provides a comprehensive learning experience that prepares candidates to become skilled data engineers and provides them with a competitive edge in the job market.
Databricks Exam Practice Test To Gain Brilliante Result: https://www.examcollectionpass.com/Databricks/Databricks-Certified-Professional-Data-Engineer-practice-exam-dumps.html